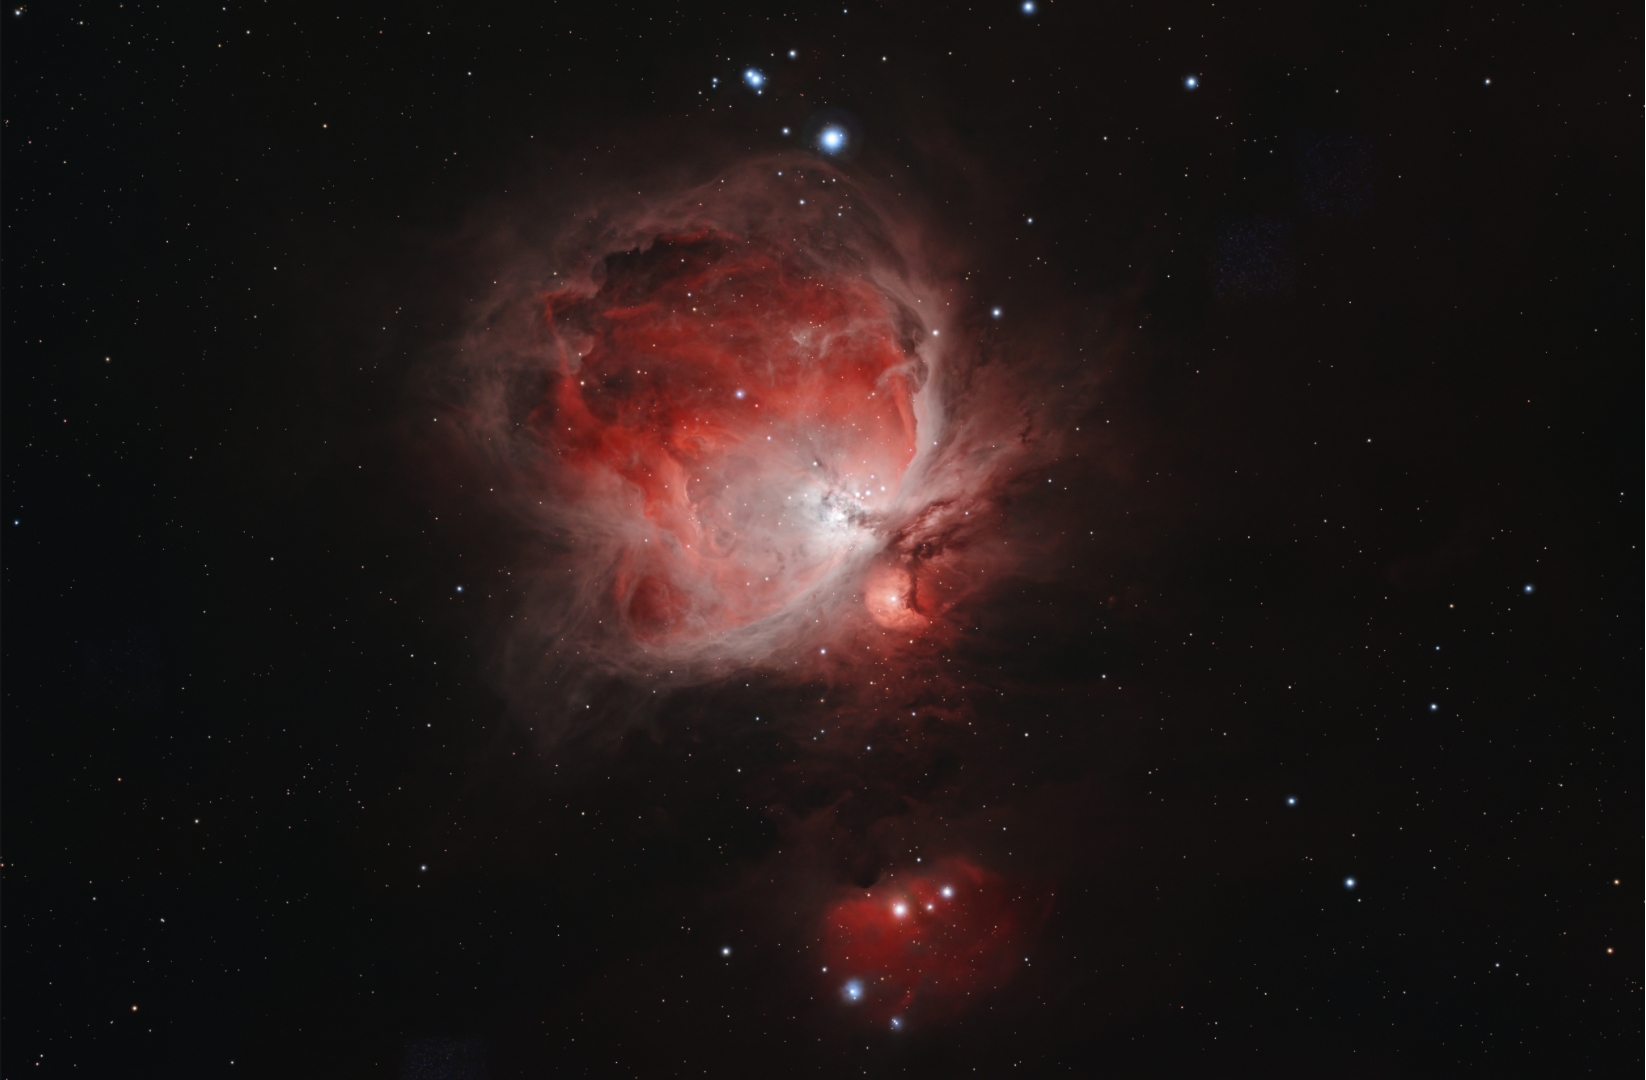
M 42 or The Great Orion Nebula.
Object
The Orion Nebula (M42) is one of the closest and most extensively studied regions
of active star formation in the Milky Way. Located approximately 1,300–1,400 light-
The nebula is an important stellar nursery, containing thousands of young stars and numerous protostars. Within its dense molecular clouds, gravity causes material to collapse into new stellar systems. Infrared observations have revealed deeply embedded young objects that are difficult or impossible to detect at visible wavelengths. Protoplanetary disks, known as proplyds, have also been observed around many young stars, providing evidence that planetary systems can form in such environments.
M42 is therefore an important object for studying the earliest stages of stellar and planetary evolution. Its relative proximity allows astronomers to investigate processes that occur throughout the Galaxy, including gas ionization, star formation, stellar feedback, and the formation of planetary systems. As a result, the Orion Nebula remains one of the most scientifically important and visually spectacular objects in modern astronomy.
Image
This image was taken over the nights of the 19th of November 2025. The image was captured with an OSC camera and processed primarily in PixInsight with plugins. The details are as follows:
Location: Cork city, Ireland (Bortle 7).
Date: 19th of November 2025.
Seeing: Poor to average.
Moon Phase: Waning Crescent, 2%.
Telescope: William Optics GT 81 Mk IV.
Barlow/Reducer: Willaim Optics Flat 6AIII 0.8X Flattener/Reducer.
Coma Corrector: N/A.
Other Optics: N/A.
Camera: ZWO ASi 2600 MC Pro
Filter 1: Optolong L-
Filter 2: Optolong Clear (for capturing RGB stars).
Controller: ZWO ASiair Pro
Guide Scope: William Optics M-
Guide Camera: ZWO Asi 120MM Mini Guide Camera.
Guiding Error: 1.24” to 0.56” RMS.
Mount: Sky Watcher EQ6-
Image Processing:
Application 1: Graxpert.
Application 2: Pleiades Astrophoto PixInsight & Plugins.
Application 3: RC Astro BlurXTerminator.
Application 4: RC Astro StarXTerminator.
Application 5: RC Astro NoiseXTerminator.
Image Capture:
Light Frames: 124 x 180 s.
Flat Frames: 60.
Dark Frames: 30 x 180 s.
Bias Frames: 30.
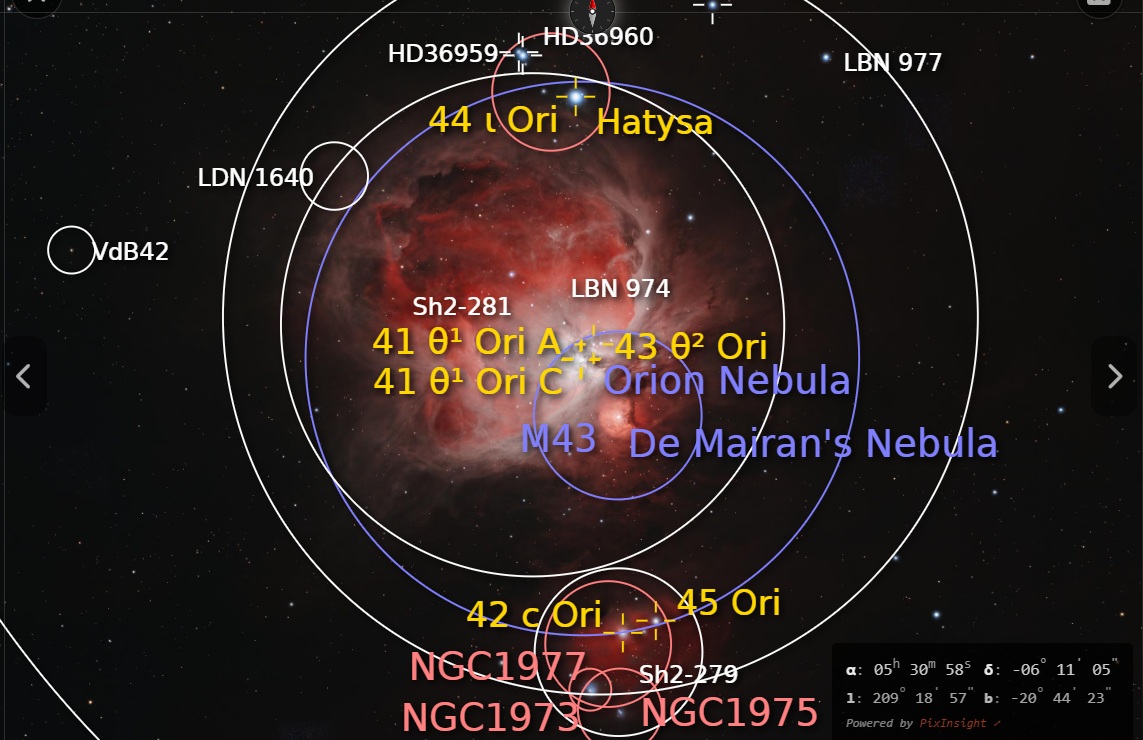
Location Annotated Image
History
M42, commonly known as the Orion Nebula, is one of the most extensively studied emission
nebulae in the Milky Way and has a long history of astronomical observation. Although
the nebula is visible to the unaided eye as a diffuse patch of light south of the
stars forming Orion’s Belt, its nebulous nature was not formally recognized until
the seventeenth century. The French astronomer Nicolas-
Physics
H II regions are clouds of predominantly ionized hydrogen surrounding hot, massive
stars. They connect stellar evolution with the thermal, chemical, and dynamical evolution
of the interstellar medium. The Orion Nebula is particularly valuable because its
proximity permits individual ionization fronts and circumstellar structures to be
resolved. Integral-
Distance and Spatial Structure
Published radio-
ℓ ≈ dθ
where ℓ is the physical length, d is the distance, and θ is the angle in radians.
At 400 pc, one arcsecond corresponds to approximately 400 astronomical units, or
0.00194 pc. Consequently, observations with subarcsecond resolution can investigate
structures on scales comparable to circumstellar disks. The bright Huygens region
is commonly interpreted as an irregular, concave ionized layer on the observer-
Photoionization and Recombination
Hydrogen photoionization occurs when a photon has sufficient energy to remove the electron:
H + hν → H⁺ + e⁻ hν ≥ 13.6 eV
Here, h is Planck’s constant and ν is photon frequency. Energy above the ionization threshold initially appears as kinetic energy of the liberated electron and contributes to heating the gas. For steady hydrogen ionization balance under the Case B approximation,
Q_abs = ∫ α_B(Tₑ) nₑ np dV
where Q_abs is the rate of stellar ionizing photons absorbed by hydrogen, α_B is
the recombination coefficient to excited states, Tₑ is electron temperature, nₑ is
electron density, np is proton density, and V is volume. Case B assumes that photons
produced by recombinations directly to the ground state are absorbed locally and
cause further ionizations. The distinction between Q_abs and the total stellar ionizing
photon output is essential: dust absorption and photon escape can reduce the fraction
available to ionize hydrogen. For a uniform, spherical, pure-
R_S = [3Q_H / (4π α_B n_H²)]^(1/3)
where Q_H is the stellar ionizing photon production rate and n_H is the hydrogen-
The hydrogen recombination timescale is approximately
t_rec = 1 / (α_B nₑ)
Using the same coefficient and nₑ = 3 × 10³ cm⁻³ gives t_rec ≈ 41 years. Thus, the
ionization state can respond to changes in illumination far more rapidly than the
large-
Emission and Physical Diagnostics
Recombination produces a cascade of hydrogen emission lines, including Hα at approximately 656.3 nm and Hβ at 486.1 nm. For optically thin Hα emission, the intrinsic intensity is
I(Hα) = [hν_Hα / (4π)] ∫ α_eff(Hα, Tₑ) nₑ np dl
where α_eff is the effective coefficient for producing Hα photons and l measures distance along the line of sight. When temperature is nearly uniform and nₑ ≈ np , the intensity follows the emission measure:
EM = ∫ nₑ² dl
Because density enters quadratically, compact dense structures can dominate the observed brightness. A bright feature therefore need not contain proportionally more mass; its brightness can also reflect compression or a longer emitting path. Collisionally excited forbidden lines provide complementary diagnostics. Square brackets in a line label indicate a radiative transition with a low spontaneous transition probability. Such transitions remain observable in sufficiently dilute gas because collisions do not always remove the excitation before a photon is emitted. A commonly used density diagnostic is
R_SII = I(6716 Å) / I(6731 Å)
Using the [S II] doublet. A temperature-
R_NII = [I(6548 Å) + I(6583 Å)] / I(5755 Å)
Using [N II]. The intensities should be corrected for extinction, and conversion
to density or temperature requires atomic transition and collision data. MUSE observations
have mapped these quantities across M42 using several ionic species. Weilbacher et
al. (2015). Measurements show substantial spatial variation. Studies of the extended
nebula report an ionized-
Gas Pressure and Stellar Feedback
For fully ionized hydrogen with electrons and protons at the same temperature, thermal pressure is approximately
P ≈ 2nₑk_B Tₑ
where k_B is Boltzmann’s constant. Helium changes the particle count modestly. For
illustrative values nₑ = 3 × 10³ cm⁻³ and Tₑ = 8,500 K, P/k_B ≈ 5.1 × 10⁷ K cm⁻³.
This estimate describes the thermal pressure of the selected ionized component. A
complete dynamical model must also consider surrounding gas pressure, magnetic fields,
turbulent motions, and stellar winds. Heating at the molecular-
Feedback also operates over larger scales. Observations of the far-
The Orion Bar and Irradiated Disks
Beyond the hydrogen ionization front, ultraviolet radiation continues to affect largely
neutral material. This photodissociation region contains transitions in molecular
abundance, temperature, and chemical state. The Orion Bar provides a particularly
accessible example because its orientation allows neighboring layers to be spatially
distinguished. JWST near-
External irradiation also alters circumstellar disks. JWST and ALMA observations
of the disk d203-
t_loss ≈ M_disk / Ṁ_loss
where M_disk is the remaining disk mass and Ṁ_loss is its mass-
Discussion and Limitations
M42 demonstrates how massive stars influence their surroundings through photoionization,
heating, winds, and disk photoevaporation. Simple equations explain the characteristic
scales of ionization balance, recombination, emission, and pressure, but their application
requires explicit assumptions. Spatially resolved observations show that the nebula
is an evolving interface between stars, ionized gas, and molecular material. Its
scientific value lies in allowing these interacting processes to be examined on scales
that are unresolved in more distant star-
References
Physical conditions in the Huygens region of the Orion nebula.” Monthly Notices of the Royal Astronomical Society, 464, 4835–4857.
Pabst, C. H. M., et al. (2020). “Expanding bubbles in Orion A: [C II] observations of M42, M43, and NGC 1977.” Astronomy & Astrophysics, 639, A2.
Peeters, E., et al. (2024). “PBerné, O., et al. (2024). “A far-
Kounkel, M., et al. (2017). “The Gould’s Belt Distances Survey (GOBELINS). II. Distances and Structure toward the Orion Molecular Clouds.” The Astrophysical Journal, 834, 142.
Menten, K. M., Reid, M. J., Forbrich, J., and Brunthaler, A. (2007). “The distance to the Orion Nebula.” Astronomy & Astrophysics, 474, 515–520.
O’Dell, C. R., Ferland, G. J., and Peimbert, M. (2017). “Structure and pDRs4All. III. JWST’s NIR spectroscopic view of the Orion Bar.” Astronomy & Astrophysics, 685, A74.
Weilbacher, P. M., et al. (2015). “A MUSE map of the central Orion Nebula (M 42).” Astronomy & Astrophysics, 582, A114.